From Everyday Observations to Problem Definition
A recurring pattern emerged: single customers frequently occupied four-person tables, while larger groups were often unable to find seating
Key Challenges and Concerns
"Revenue comes from spatial efficiency, not simply from the number of drinks ordered."
Customer Mismatch: A single customer occupying a large multi-seat table for an extended period of time continues to occur
Loss of Group Customers: 3-4 person meeting-oriented customers are unable to find seating and end up leaving upon arrival
Business Impact: Minor spatial layout bottleneck contributes to reduced table turnover and ultimately leads to decreased revenue

Data Collection Process
Time Period:
March 1, 2026 - May 30, 2026
Monday to Friday from 7:00 AM to 4:00 PM
Data Collection Method:
Direct in-person observation of customers
Observing 7 customers per day
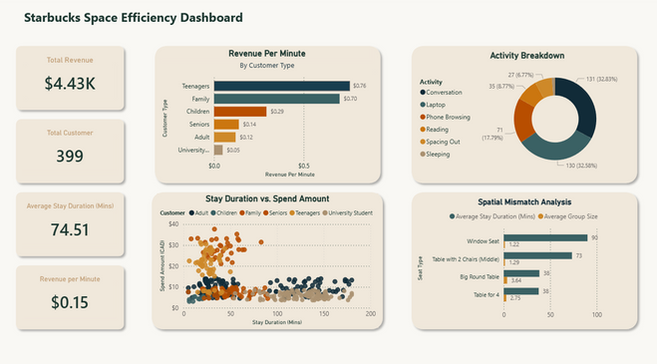
Total data: 399
Value of Primary Data
This data captures customer characteristics and spatial preferences that can only be identified through on-site observation.
This manually collected dataset served as a strong foundation for building a meaningful and reliable analytical model.
Data
Customer Type Group Size
Teenager 1, 2, 3, 4, 5
Adult
Senior
Family
University Student
Children

Seat Type Attire
Window Seat Casual
Table for 4 Business Casual
Table for 2 Business formal
Round table

Activity
Conversation Laptop Phone Browsing Reading Spacing Out Sleeping


Data Analysis
Which customer generates the highest financial velocity per minute, and where are the operational dead zones?

💡Insights
Top Performers: Teenagers ($0.76/min) and Family ($0.70/min) yield the highest financial return due to fast, multi-item purchases.
The Bottom Drain: University Students ($0.05/min) and Adults ($0.12/min) score the lowest in financial efficiency due to single-item orders with prolonged stays.
🔎 Data Interpretation
More customers do not guarantee higher revenue; it depends on seating efficiency.
The current layout treats a 2-hour low-yield student the same as a 20-minute high-yield family.
We must structurally optimize the space so high-spending, fast-turning segments can always find a seat instead of walking out.
Data Analysis
What are customers actually doing on the floor, and how does their behaviour dictate their spatial footprint?

💡Insights
Conversation (32.83%) and Laptop Use (32.58%) dominate over 65% of all floor activity, while phone browsing, reading, and spacing out make up the remaining minority distribution.
🔎 Data Interpretation
The floor is split down the middle between high-RPM (Revenue Per Minute) social conversationalists and low-RPM remote laptop workers.
Long-stay laptop users monopolize the space, naturally blocking high-spacing, profitable customers from finding open seats.
Data Analysis
Is there a correlation between time spent on the floor and total transaction values?

💡Insights
High Spend, Short Stay (Top Left): Teenagers and Family cluster in high transaction amount ($20 - $40 CAD) compressed within short, 50-minute windows.
Low Spend, Long Stay (Bottom Right): University Students and Adults stretch far across the baseline, showing extreme stay duration locked into low spending.
🔎 Data Interpretation
In reality, revenue per minute drops exponentially the longer a customer sits.
A single student occupying a 4-person table for two hours blocks substantial revenue.
That same space could have cycled through three rotations of high-spending family groups.
Data Analysis
Are group sizes structurally aligned with the seating capacity they choose to occupy?

💡Insights
Window Seats & Tables with 2 Chairs are heavily anchored by individual customers (average size 1.22 to 1.29) for the longest durations (73 to 90 minutes).
Big Round Table and Table for 4 are frequently occupied by small pairs, yielding a low average group size of 2.75 to 3.64 during peak hours.
🔎 Data Interpretation
Single customers are consistently over-consuming spatial assets by sitting at large tables designed for groups.
Strategic Seating & Layout Optimization
"Study & Work Zone"
Designate the corner section of the store as a quiet zone specifically tailored for laptop and reading activities.
Replace 4-person tables in this zone with individual Plug-In Bar Seats or a small table for single occupants.
"Conversation Zone"
Position round coffee tables and seats without power outlets near the entrance and windows.
This targets high-RPM groups who have shorter stay durations, encouraging faster table turnover.

"Visual Seating Guidance"
Install clear, friendly floor and table signage at the entrance of each zone to guide customers toward the seating setup most compatible with their intended activity.

Operational Seating Policies
"Minimum Occupancy for Large Tables"
Implement polite table signage on Big Round Tables and Tables for 4, indicating a "Minimum 3 People during Peak Hours (12 PM - 3 PM)" policy to prevent 1-person monopolization.

"Soft Time-Limits on Power Outlets"
Introduce a visible, friendly guidelines policy (e.g., "2-hour limit on outlet-serviced seats during peak") to improve seat availability for waiting customers.
